Vessel Lineups
Data on the agri commodities export shipment by sea vessels from the ports of Ukraine, Romania and Bulgaria is provided.
You can sort the data by making a selection according to the following positions: season, vessel status (Sailed, ETA), terminal, cargo, month, mode (export/transit), shipper, charterer, destination country, port of loading
There are also 2 rating tables available in the section: by the most exported cargo (in the context of one/several/all seasons), by the largest ports (seasonally, monthly).
Section update frequency: Ukraine – twice a week, Bulgaria and Romania – once a week
Periods available: Bulgaria: 2016/17 MY – to the present time, Romania, Ukraine: 2015/16 MY – up to now
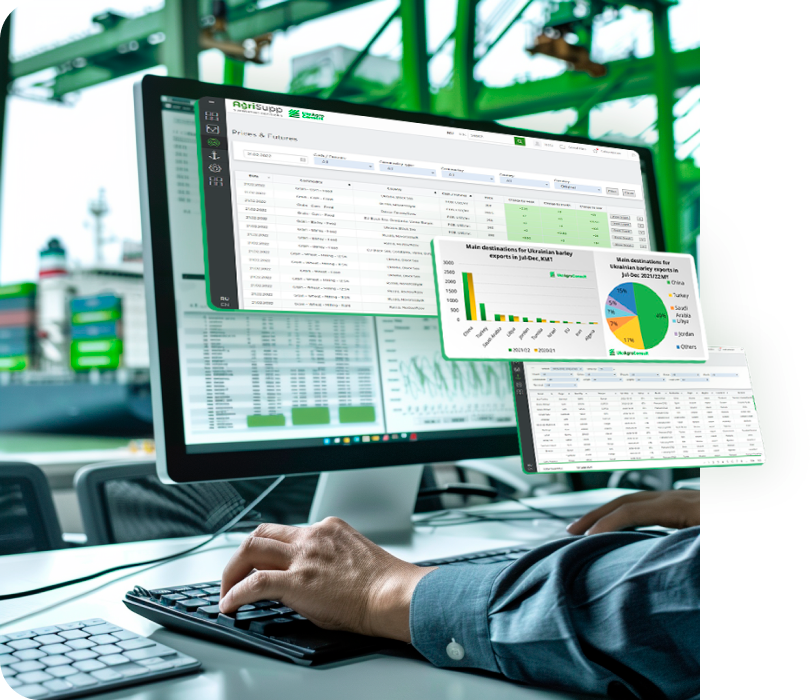
Vessel Line Up – analytics and online reports on agricultural exports from Black Sea ports
The AgriSupp platform offers a professional Vessel Lineup tool — online reports with detailed information on agricultural cargo shipments by sea from the ports of Ukraine, Romania, and Bulgaria. It is a convenient data source for analyzing market trends, monitoring logistics, and tracking port activity across the region.
The platform combines historical data with up-to-date information that is updated as follows:
-
- Ukraine — twice a week
-
- Romania and Bulgaria — once a week
Available data periods:
-
- Bulgaria — from the 2016/17 marketing year
-
- Romania and Ukraine — from the 2015/16 marketing year
To make navigation convenient, the Vessel Lineup report is divided into several blocks. Each of them provides its own data perspective — from detailed vessel lists to aggregated rankings of ports and cargoes. Below is a detailed overview of all these blocks.
Data Geography
Before working with the figures, it is important to understand which countries and ports are covered by the service. This allows users to immediately determine whether analytics for a specific region are available.
The service covers key ports in three countries:
- - Ukraine: Chornomorsk, Odesa, Yuzhny, Reni, Izmail
- - Romania: Constanța, Brăila
- - Bulgaria: Varna, Burgas, Balchik, Lom, Vidin, Silistra
In addition to logistics information, you can obtain a broader overview of export trade flows in the Agricultural Export Statistics section. It provides regular data updates for Ukraine, Kazakhstan, Romania, Bulgaria, and other countries, including historical indicators and current statistics.
|
Country |
Update frequency |
Data periods |
Main ports |
|
Ukraine |
2 times per week | from 2015/16 MY | Chornomorsk, Odesa, Yuzhny, Reni, Izmail |
|
Romania |
1 time per week | from 2015/16 MY | Constanța, Brăila |
|
Bulgaria |
1 time per week | from 2016/17 MY | Varna, Burgas, Balchik, Lom, Vidin, Silistra |
Section Structure
To ensure maximum clarity, the data is divided into three main analytical blocks. This helps users quickly find the information they need — whether it is details of a specific vessel or an overall country-level picture.
For each country, the following are available:
- 1. Lineup Reports — a complete list of vessels with shipment details
- 2. TOP Cargoes — rankings of key export products with monthly dynamics
- 3. TOP Ports — distribution of shipment volumes between ports with visualization
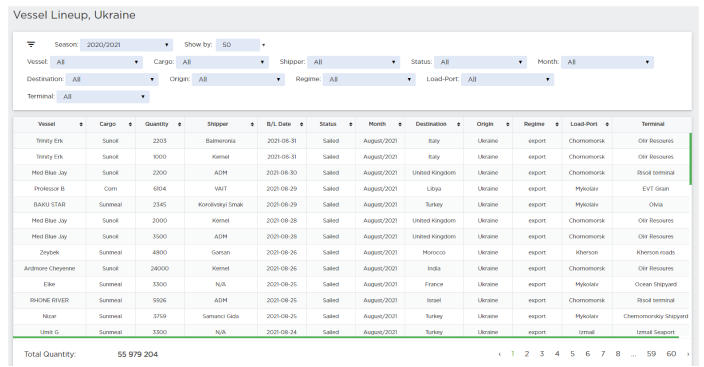
Lineup Reports: What They Contain
This block is the core of the analytics. It provides detailed information on each shipment, allowing users to track logistics in real time and analyze past deliveries.
Each table entry includes:
- Vessel name
- Cargo type (grains, meals, oils, pulses, sugar, etc.)
- Cargo volume, t
- Shipper
- Shipment date (B/L Date)
- Status: Sailed (shipped) or ETA (expected)
- Month and year
- Destination country
- Origin
- Mode: export or transit
- Loading port
- Terminal
TOP Cargoes
This block is convenient for users who want to see not only individual shipments but also the overall export volume picture for each commodity. It makes it easy to track dynamics and seasonality.
- - Data is displayed on a monthly basis for the selected season.
- - Allows quick assessment of export volumes by commodity, identification of peak periods, and seasonal trends.
- - Covers the main categories:
- - Cereals: wheat, corn, barley
- - Meals: sunflower, soybean, rapeseed meals
- - Oilseeds: rapeseed, soybeans, sunflower
- - Vegoils: sunflower, rapeseed, soybean oils
- - Pulses: peas, lentils
- - Sugar
TOP Ports
A section for quickly assessing which ports are key for exports in the selected period. This helps to understand the concentration of logistics flows.
- - Port rankings with shipment volumes calculated in tonnes for a season or a specific month.
- - Data visualization in the form of pie charts for quick understanding of each port’s share in total exports.
Interactive Features
To allow users to adapt data to their needs, the platform offers a set of tools for configuring and saving selections.
- - Flexible filtering by season, month, vessel, cargo, shipper, destination country, terminal, status, mode, and port.
- - Creation of links to selections for quick access by colleagues or clients.
- - Adding to the Dashboard for personalized monitoring.
- - Subscription to updates to receive the latest data immediately after publication.
For users who combine logistics analysis with price trends, the platform also offers the Prices and Quotations section — where prices for grains, oilseeds, and meals under FOB, CPT, and EXW terms can be tracked daily.
Vessel Lineup by AgriSupp provides verified data, an intuitive interface, and flexible analytical tools that help traders, analysts, logisticians, and exporters work with the agricultural logistics market as efficiently as possible.
Frequently Asked Questions about Vessel Lineup Reports
1. What is Vessel Lineup on the AgriSupp platform?
Vessel Lineup is an online reporting service with detailed information on agricultural product shipments from the ports of Ukraine, Romania, and Bulgaria. The service allows users to track logistics, analyze historical data, and monitor current shipments.
2. How often is data updated in Lineup reports?
Data for Ukraine is updated twice a week, while data for Romania and Bulgaria is updated once a week. This ensures users have access to the most up-to-date information.
3. What types of reports are available in the Vessel Lineup section?
Users have access to three main blocks: detailed Lineup Reports with information on each vessel, TOP Cargoes with monthly dynamics, and TOP Ports with visualization of shipment volumes.
4. What parameters can be filtered in the reports?
The system allows filtering data by season, month, vessel, cargo, shipper, destination country, terminal, status, mode, and loading port.